
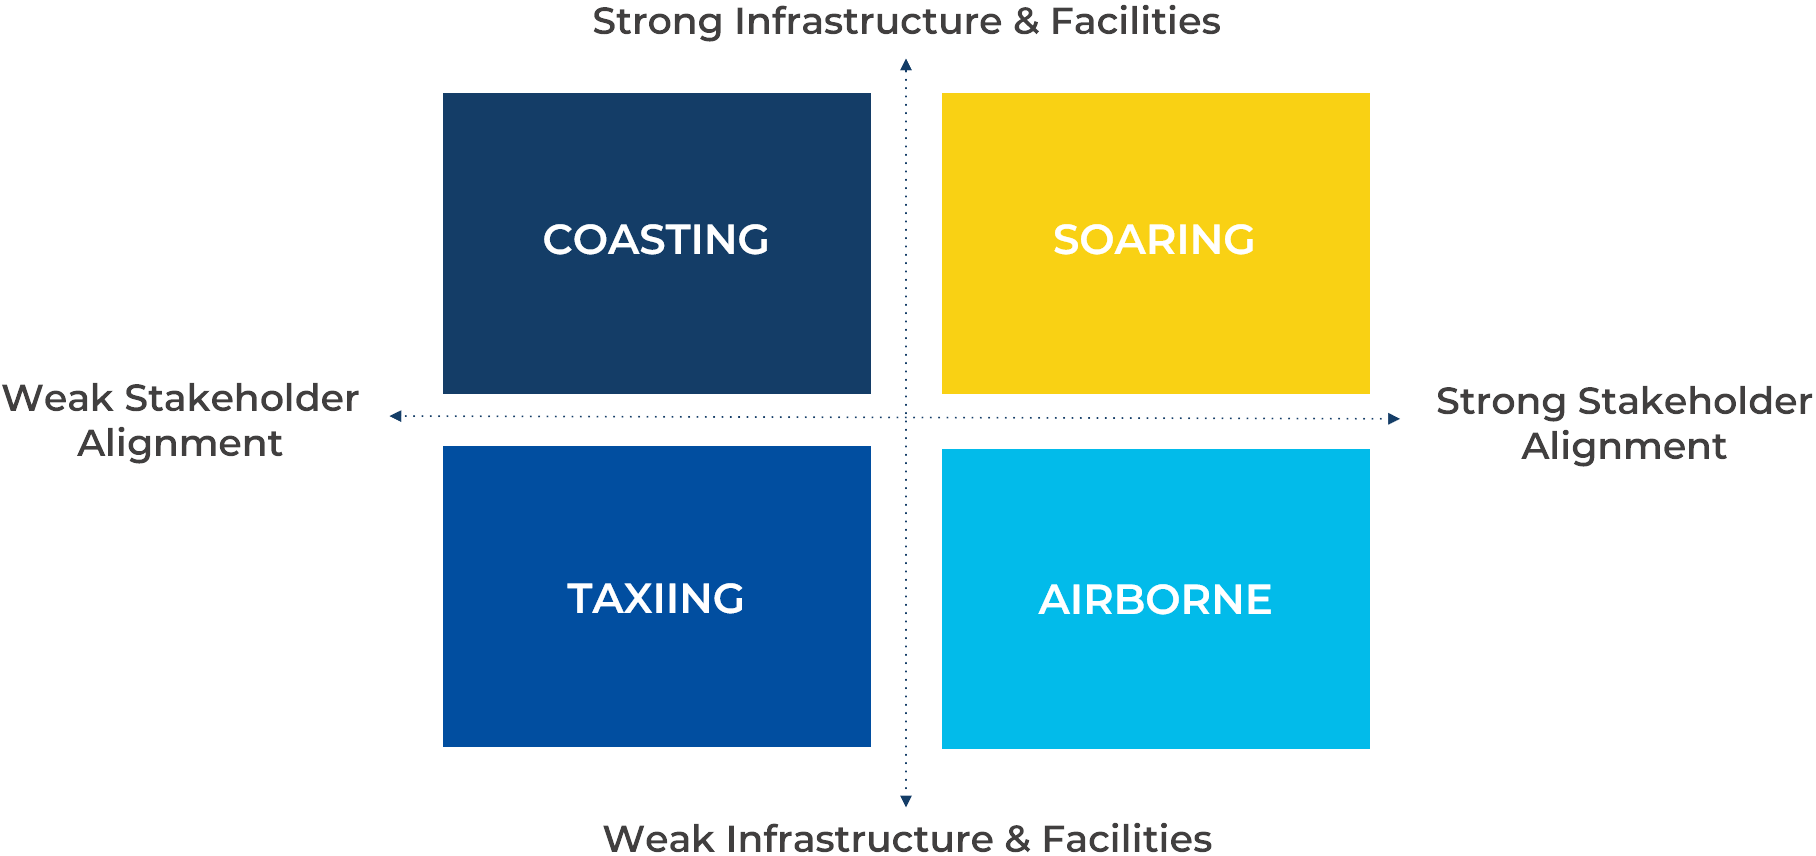
The AirportNEXT Scenario Model
Includes two independent critical success factors: Infrastructure & Facilities, and Stakeholder Alignment.
Both of the critical success factors are made up of six independent variables.
Mapping the two critical success factors, with an industry average center point, allocates each airport into one of four possible scenarios: AIRBORNE, TAXIING, COASTING, or SOARING.
Infrastructure & Facilities Variables
Six variables are used to assess airport Infrastructure & Facilities. Covering these are 49 survey statements.
Terminal
Transportation Access
Services

Technology

Security

Border

Stakeholder Alignment Variables
Six variables are used to assess Stakeholder Alignment. Covering these are 40 survey statements.
Air Service

Government Relations

Community Support

Workforce & Culture

Sustainability

Economic Development & Tourism

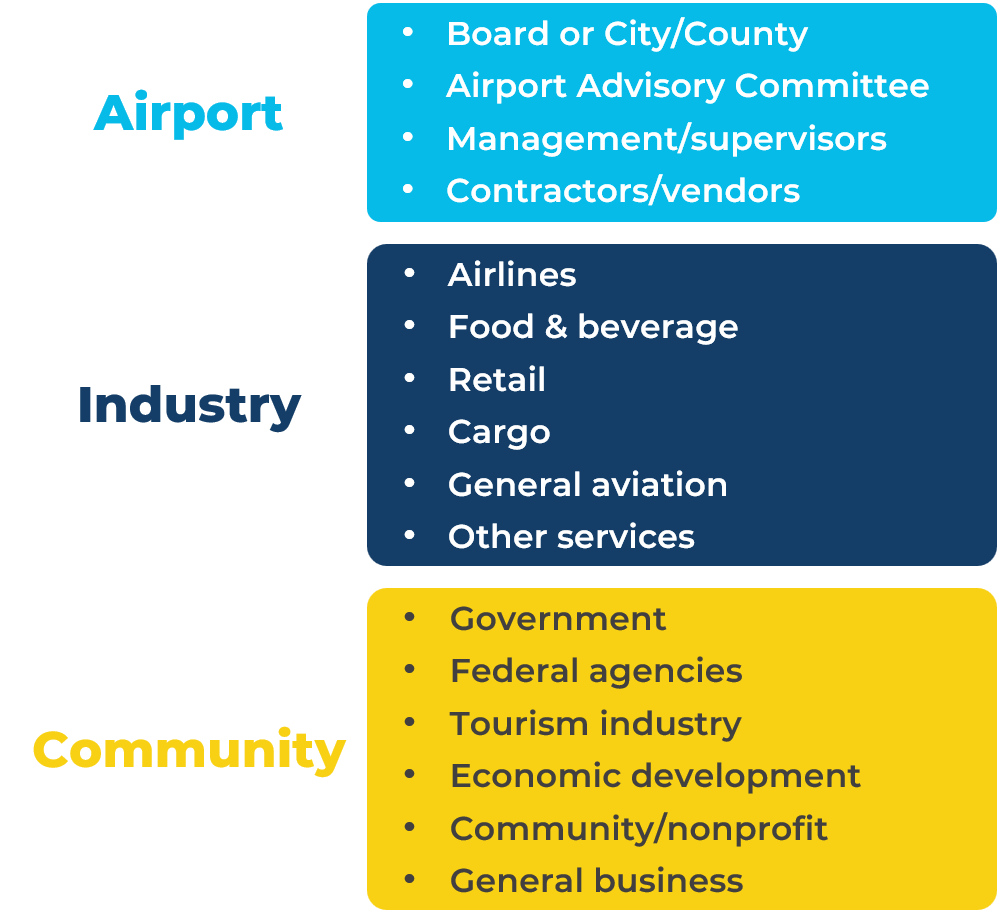
Three Key Stakeholder Groups
The individual airports survey a total of 16 different stakeholder categories, over the course of approximately six weeks.
These 16 stakeholders are allocated into three separate stakeholder groups: Airport, Industry and Community.
Each survey statement asks the stakeholders for their perceived performance from: strongly disagree, disagree, neutral, agree, to strongly agree.
The completed surveys are then sent directly and confidentially to the AirportNEXT team.
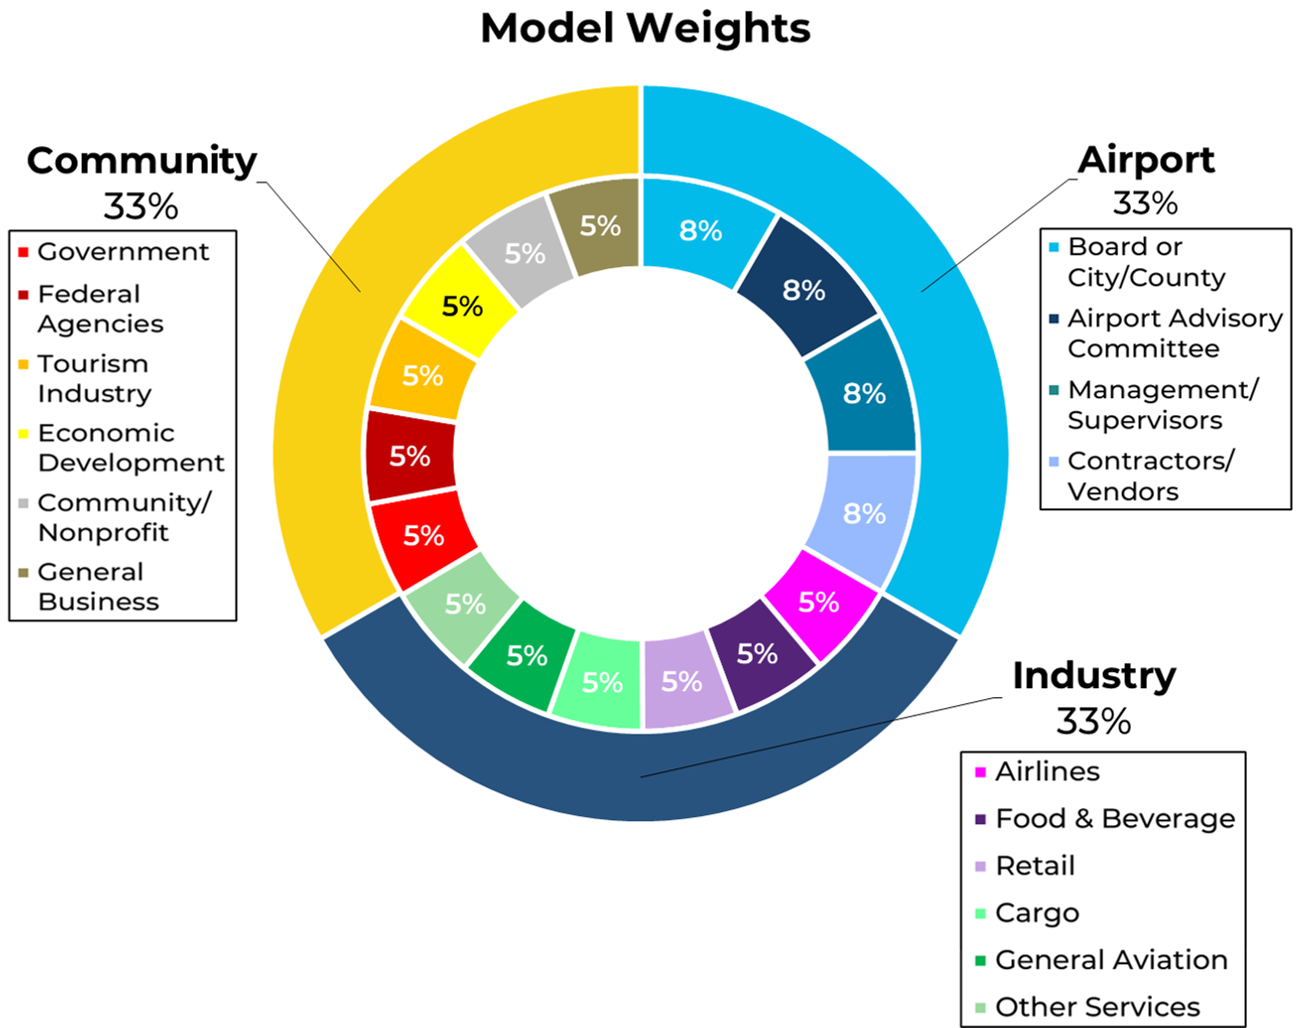
Model Analytics
A weighting is applied so all stakeholders are allocated a consistent contribution in every metric.
The weighting structure is required to compare airports, create tier averages, and prevents a single stakeholder category from overly effecting the results.
For example, an airport may have an above average amount of Retail responses, but they will always have the same weighting of 5%, across all metrics.
Industry and Tier comparisons
Every metric is compared to both the aggregate industry and tier averages.
Four tiers are used in the AirportNEXT assessment, based on the airport’s most recent year of total enplaned and deplaned passengers.
Additionally, each airport is given 200 separate ranking metrics. These come from their Industry and Tier ranking for all 87 statements, 12 variables, 2 critical success factors, and the overall AirportNEXT score, which is the sum of the two critical success factors.
Awards are presented to the best performing airports of each year.
Tier 4 (over 16 million PAX)
Dallas Love Field
Minneapolis–Saint Paul International
Montréal Trudeau International
Philadelphia International
Vancouver International
Tier 3 (4 million - 16 million PAX)
Cleveland Hopkins International
Edmonton International
Halifax Stanfield International
Milwaukee Mitchell International
Ottawa International
Tier 2 (850,000 - 4 million PAX)
Greenville–Spartanburg International
Harrisburg International
Kelowna International
Palm Springs International
Victoria International
Tier 1 (Under 850,000 PAX)
Charles M. Schulz–Sonoma County
Charlottetown
Deer Lake Regional
Fort McMurray
Fredericton International
Gander International
Kamloops
Prince George
Quad Cities International
Region of Waterloo International